

Used-space growth
View the observed trend, estimated monthly growth and an indicative threshold or exhaustion date when the sample supports it.

Argus Horizon
Horizon turns disk and memory history into a capacity-focused view: observed data, recurring patterns and explicitly indicative forecasts with visible limits.
Capacity planning, not guesswork
Choose a 3, 6 or 12-month observation window and a 1, 3, 6 or 12-month forecast. When the data is sufficient, Argus estimates growth and when a threshold may be reached.
View the observed trend, estimated monthly growth and an indicative threshold or exhaustion date when the sample supports it.
Heatmaps by day and hour and weekly charts show periods observed above the threshold, not the average across the entire day.
Short history, irregular data, large gaps or stale samples prevent a misleading forecast.
The same view compares recent behavior with a longer trend without mixing observed and estimated data.
The observable foundation
CPU and memory are measured over time using the detail, thresholds and intervals actually received. This telemetry, collected from endpoint SRV-CORE-042 di Aurora Systems S.p.A., provides a reliable foundation for identifying trends and recurring patterns.
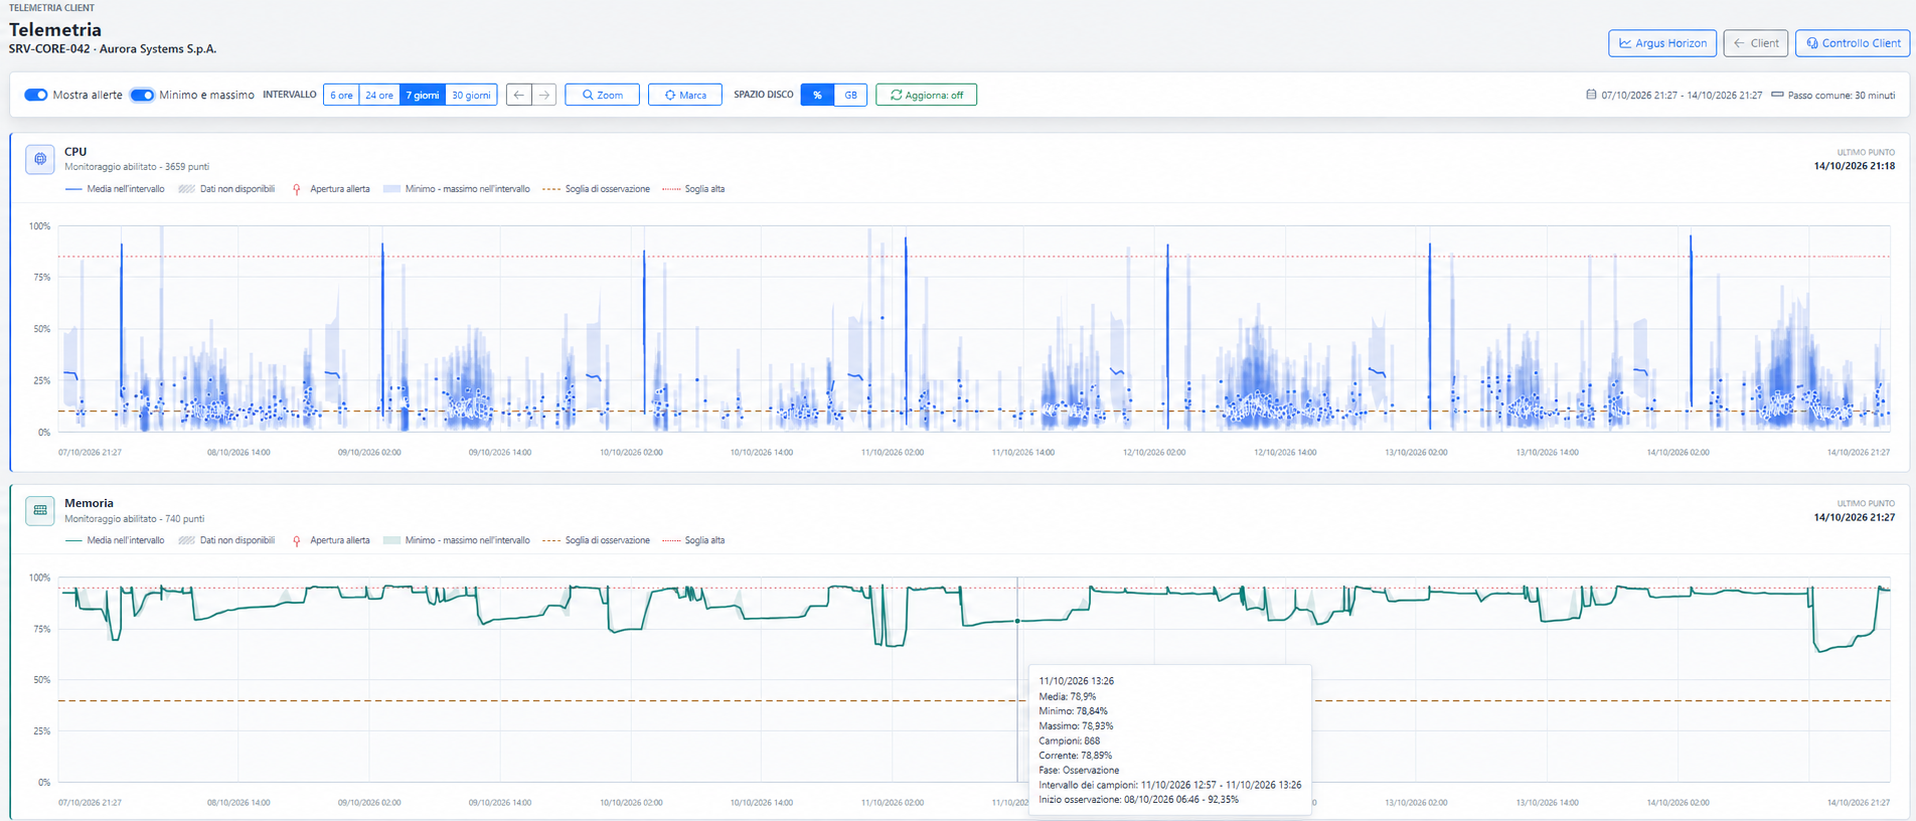
The view preserves peaks, lows, highs and alert openings. Technicians can distinguish an occasional episode from pressure that recurs consistently.
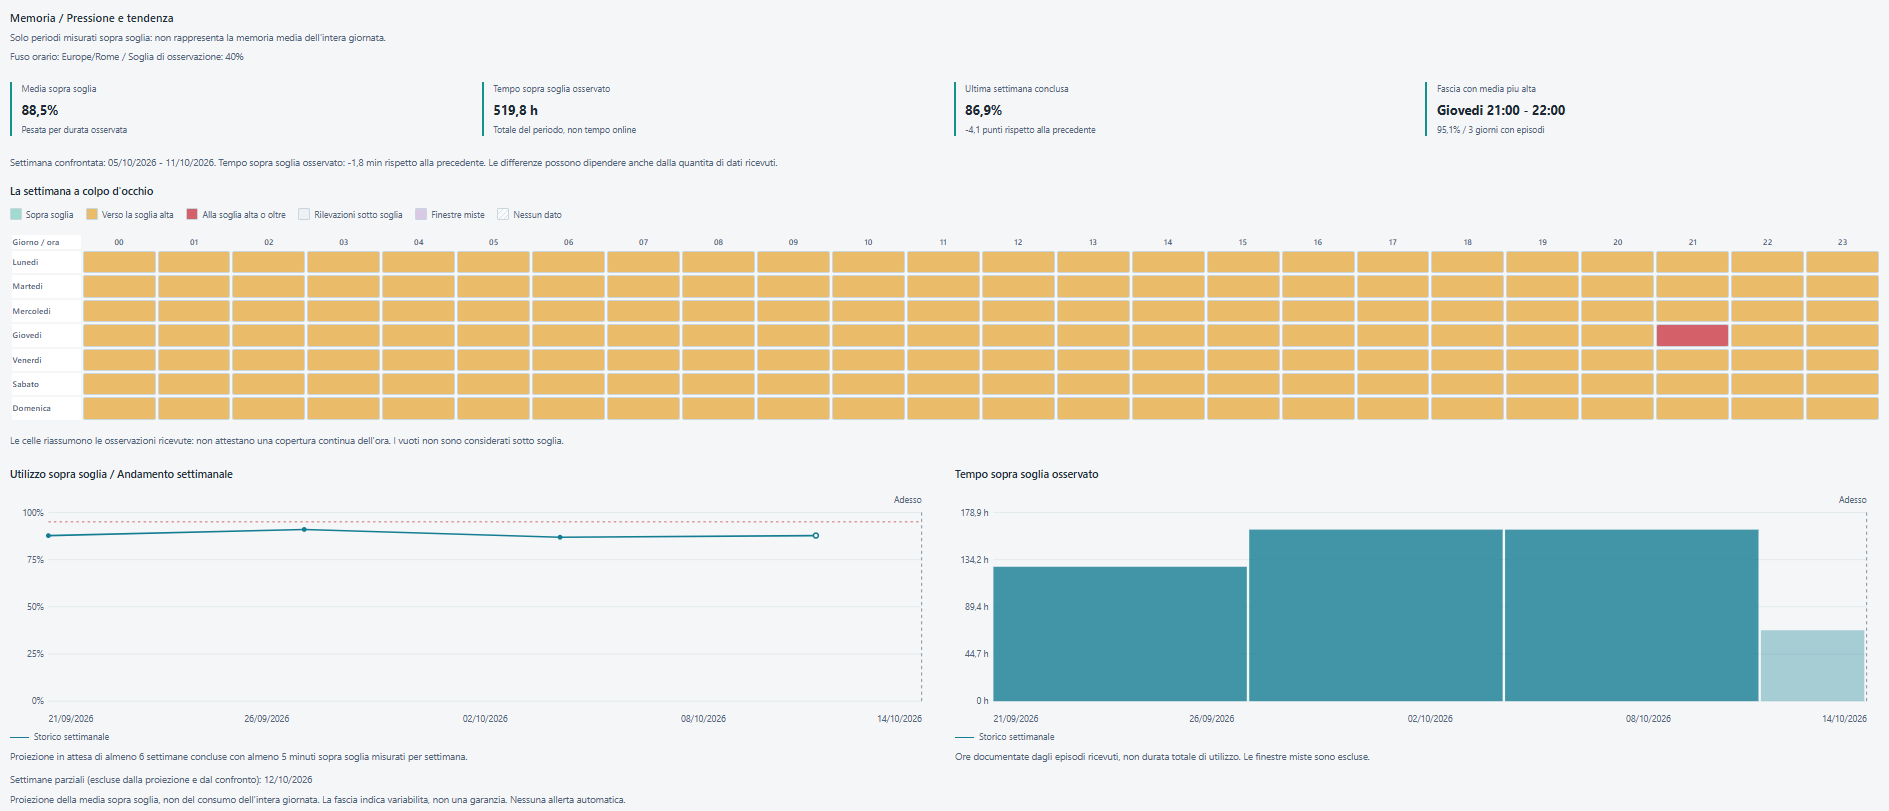
The heatmap organizes episodes by day and hour; charts compare completed weeks and show how much time was actually observed above the threshold.
Beyond the present moment
Horizon visually separates what Argus measured from what the model projects. The solid line shows history; the following segment builds a future scenario and the shaded band makes its variability visible.
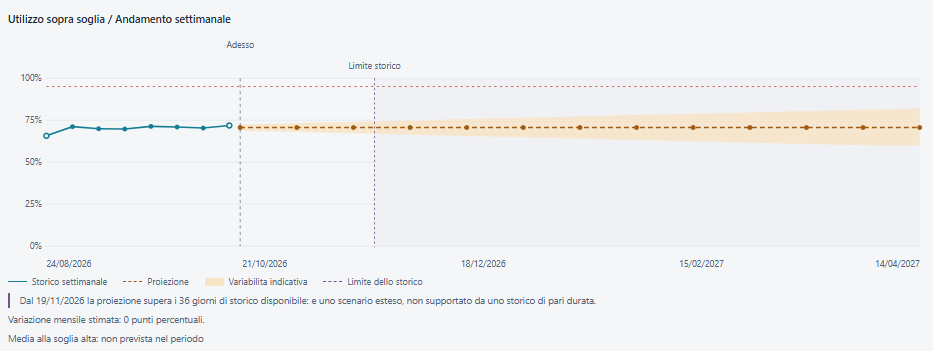
The forecast extends observed behavior and signals when the scenario reaches beyond an equivalent amount of history. The result remains useful precisely because its limit is explicit.
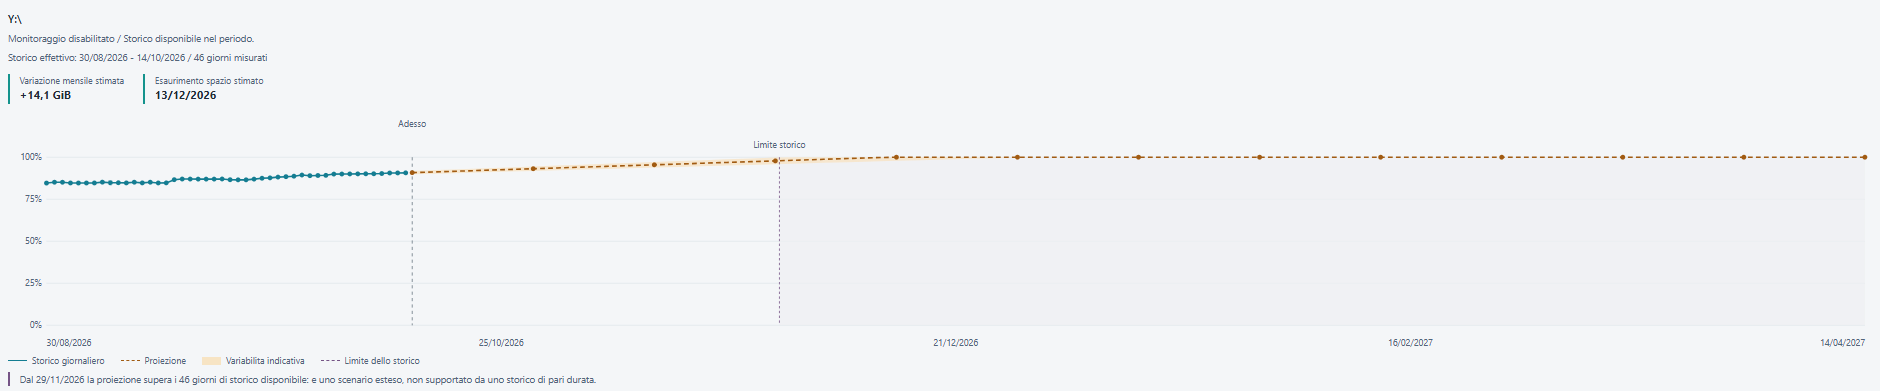
For storage, Horizon turns the trend into operational capacity: estimated monthly change, progress toward the threshold and a possible exhaustion date. IT can plan before free space becomes an emergency.
Horizon extends an observed trend when data quality, density and recency support it. Workload changes, cleanups, migrations or new uses can alter the trajectory.