

Latest scan
The host appears in the completed acquisition of at least one selected source.

Network Discovery
Each Argus Client observes its part of the network. Argus preserves and correlates the evidence to build a readable, historical and exportable company-wide view.
Argus Client as an observation point
Argus Client collects interfaces, local networks, gateways, DNS, routes, ARP cache, reached hosts, ports and services. Every result retains its date, origin, mode and duration so technicians always know when and from where the network was observed.
Execution time, origin and scan depth.
Interfaces, networks, routes, gateways and DNS visible to the endpoint.
Hosts, addresses, ports, services and detection method.
The header summarizes what is needed to interpret the result correctly: when the scan was executed and received, whether it was scheduled, the mode used, host count and duration.
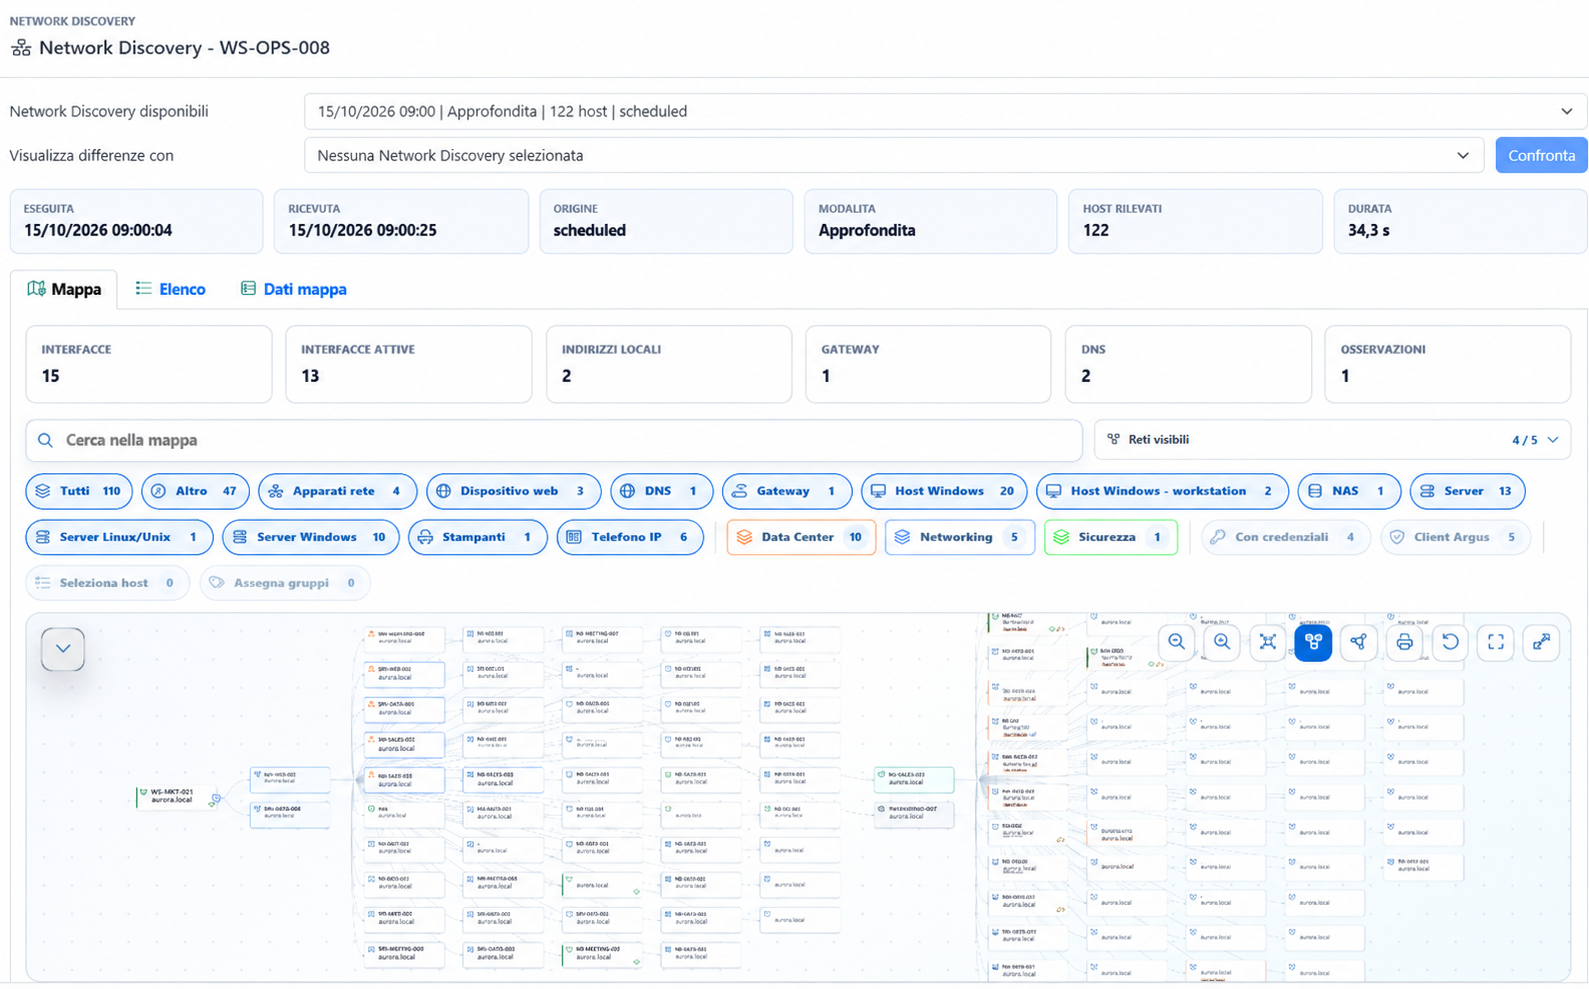
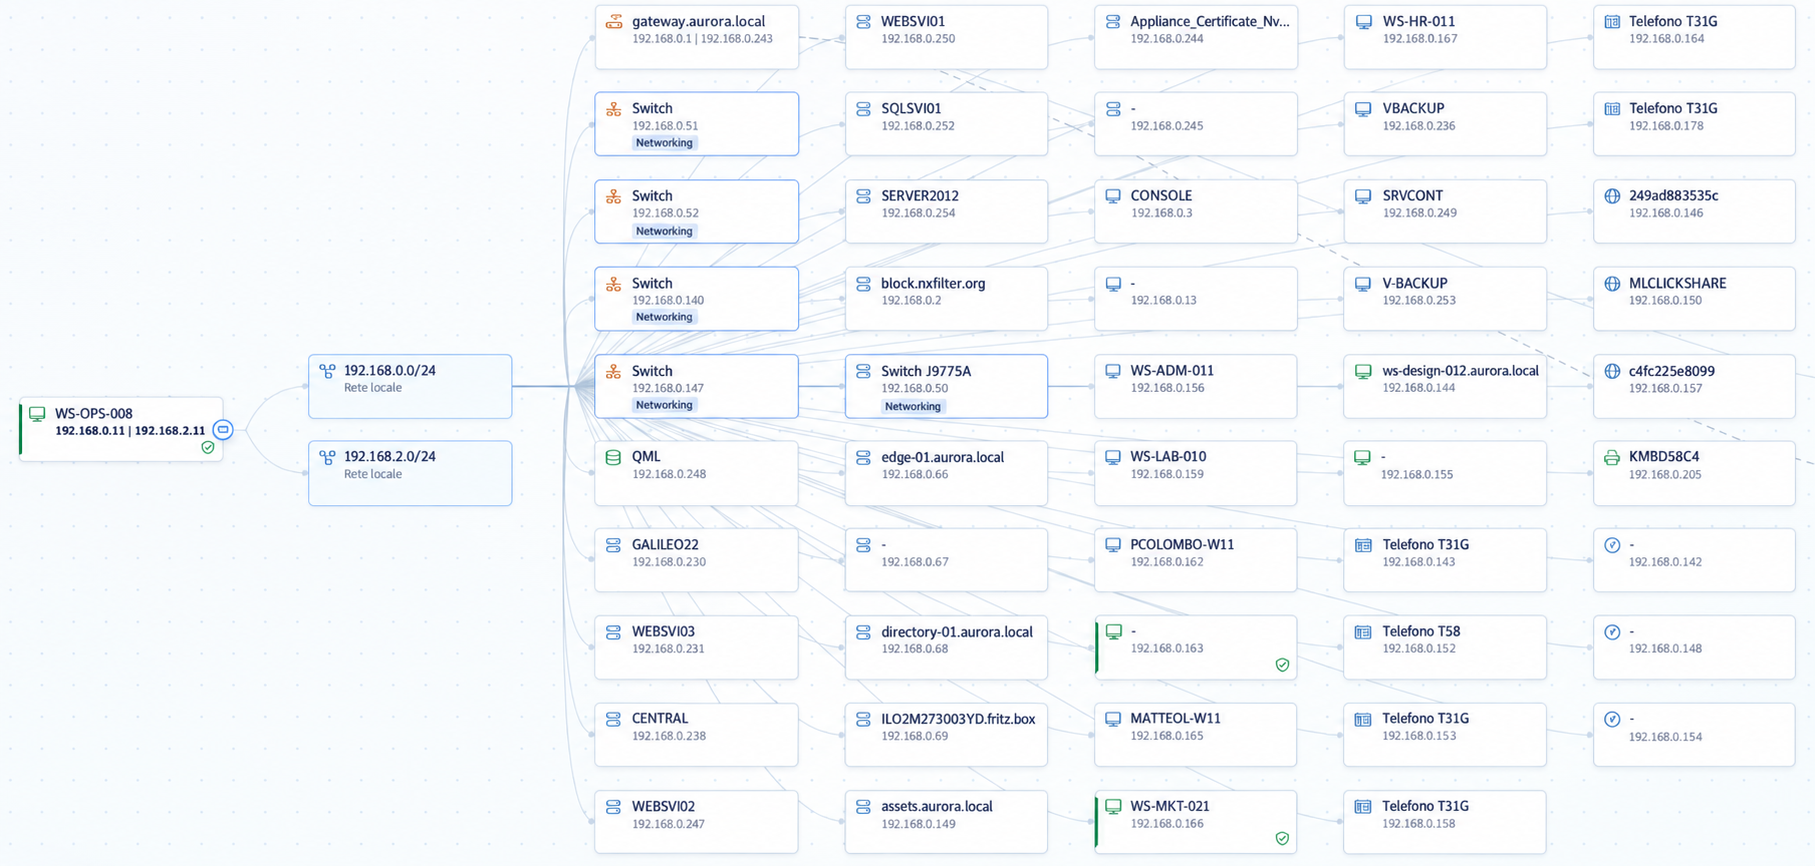
The hierarchical view organizes results by origin. Argus Client is the starting point, observed networks form the second level and hosts appear with their address and classification.
This distinguishes directly connected devices from those reached through known routes and makes investigation paths immediately visible.
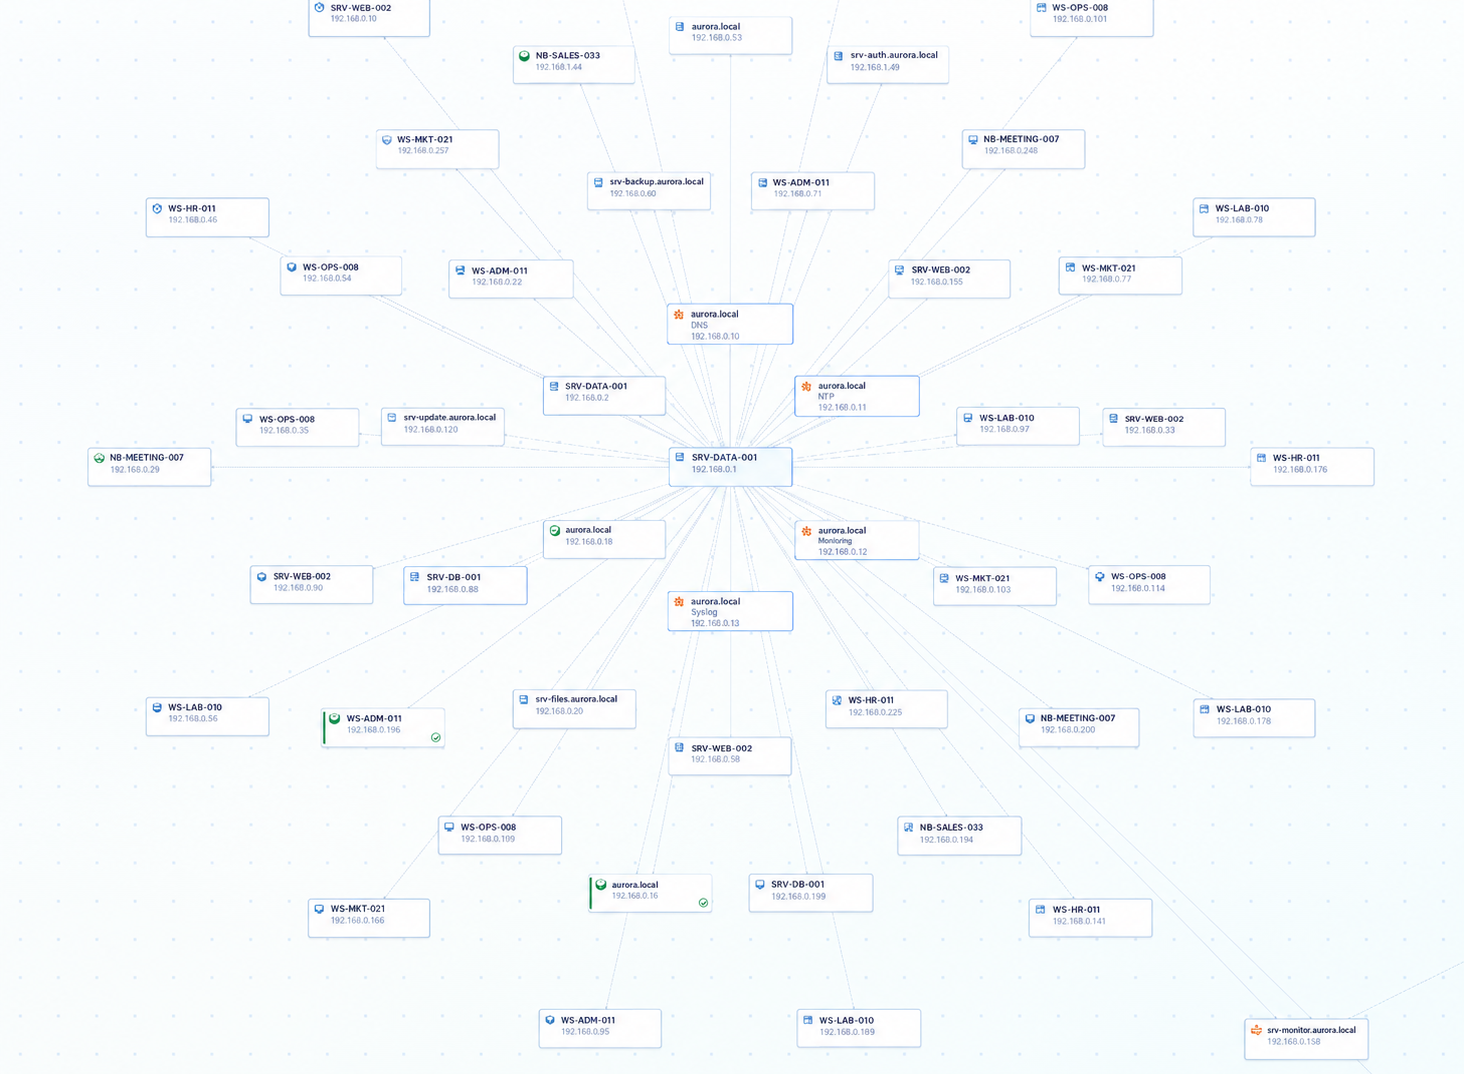
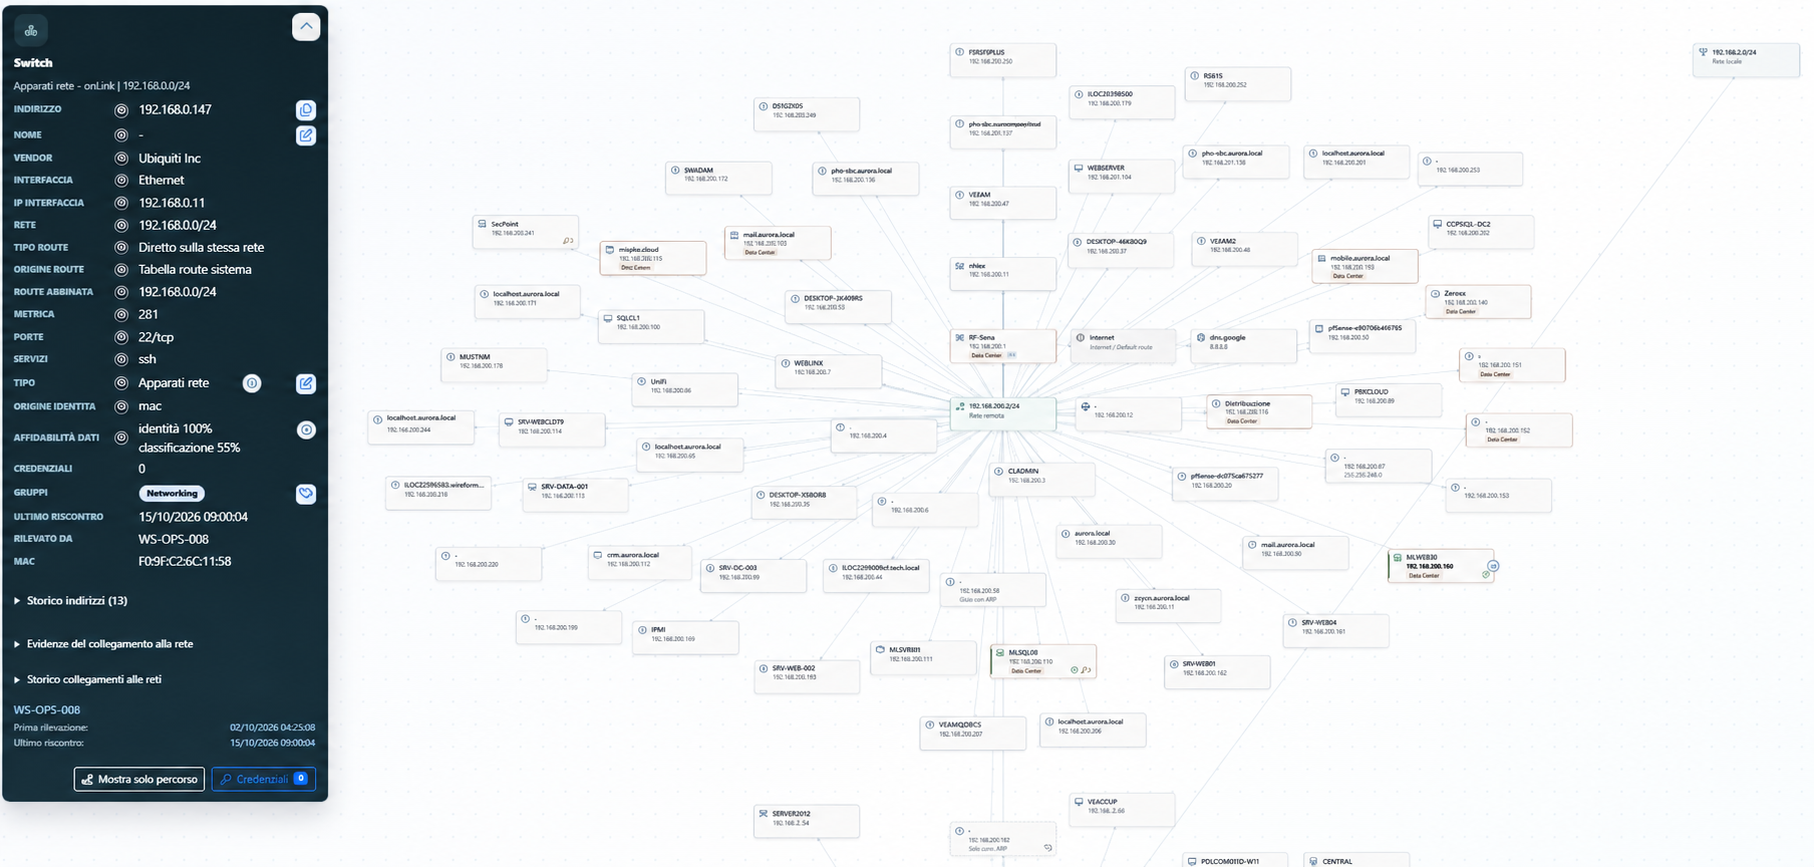
The radial layout places the selected network at the center and distributes detected elements around it. It is particularly useful for comparing host density at a glance or isolating a segment.
Company-wide consolidated view
The Monitor consolidates scans from selected endpoints and combines compatible observations without losing provenance. The company gains a cross-environment map of networks, sites, hosts and services built from multiple observation points.
Endpoint acquisitions cover different segments and paths.
Compatible evidence is linked to the same asset while conflicts remain visible.
First and last observations help interpret infrastructure evolution.
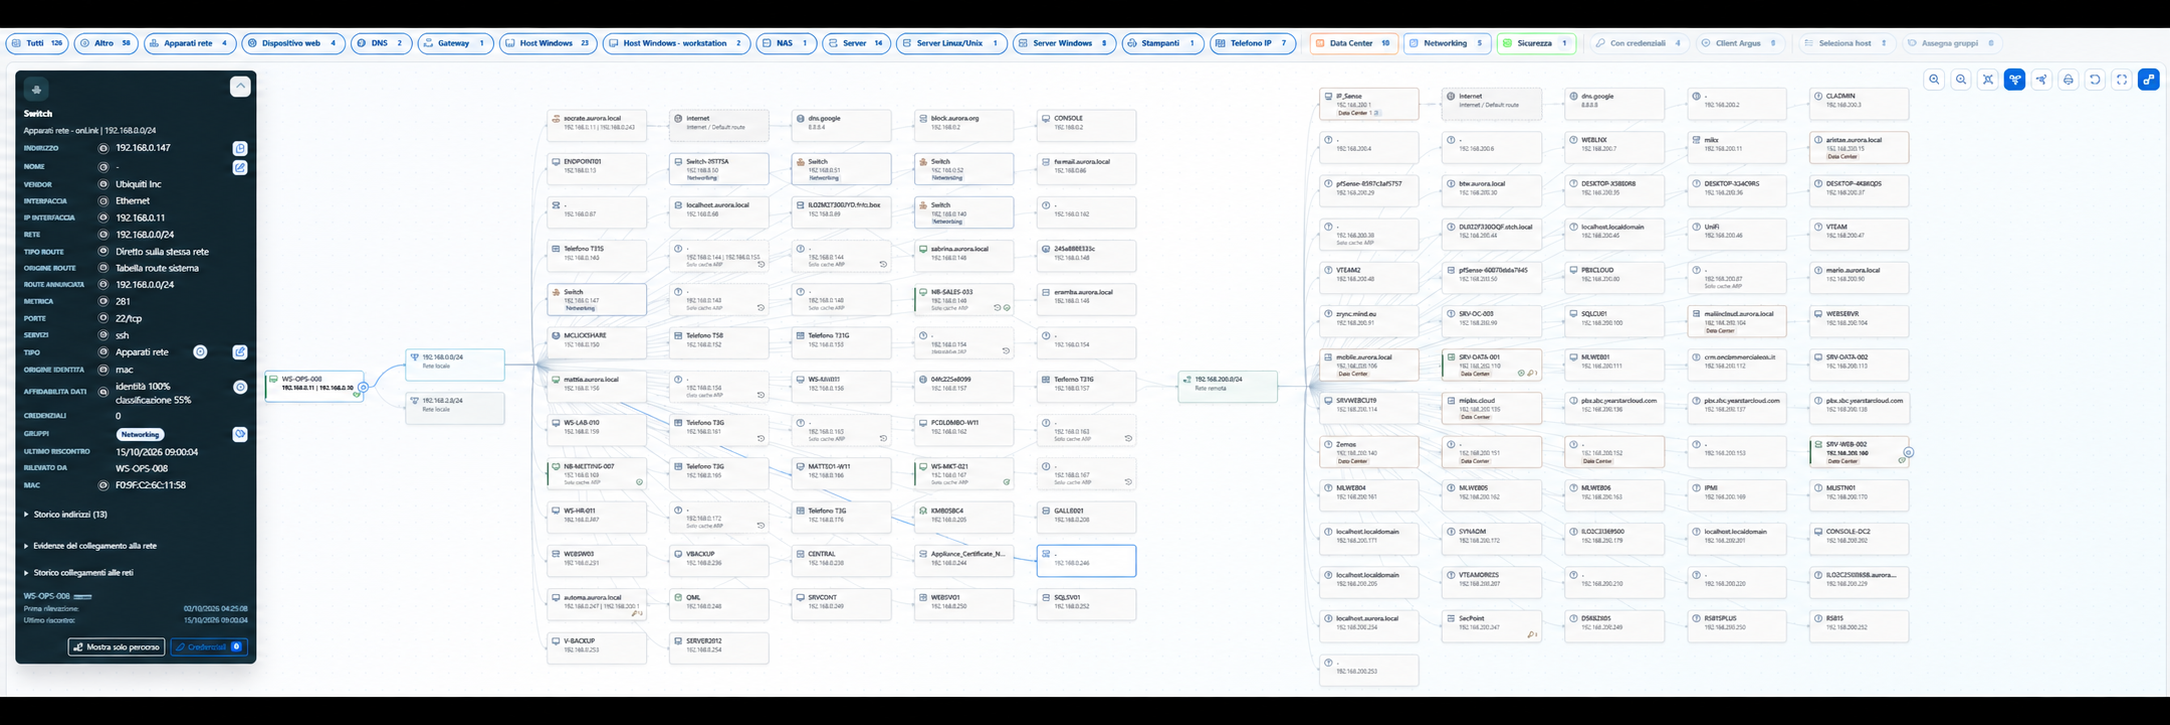
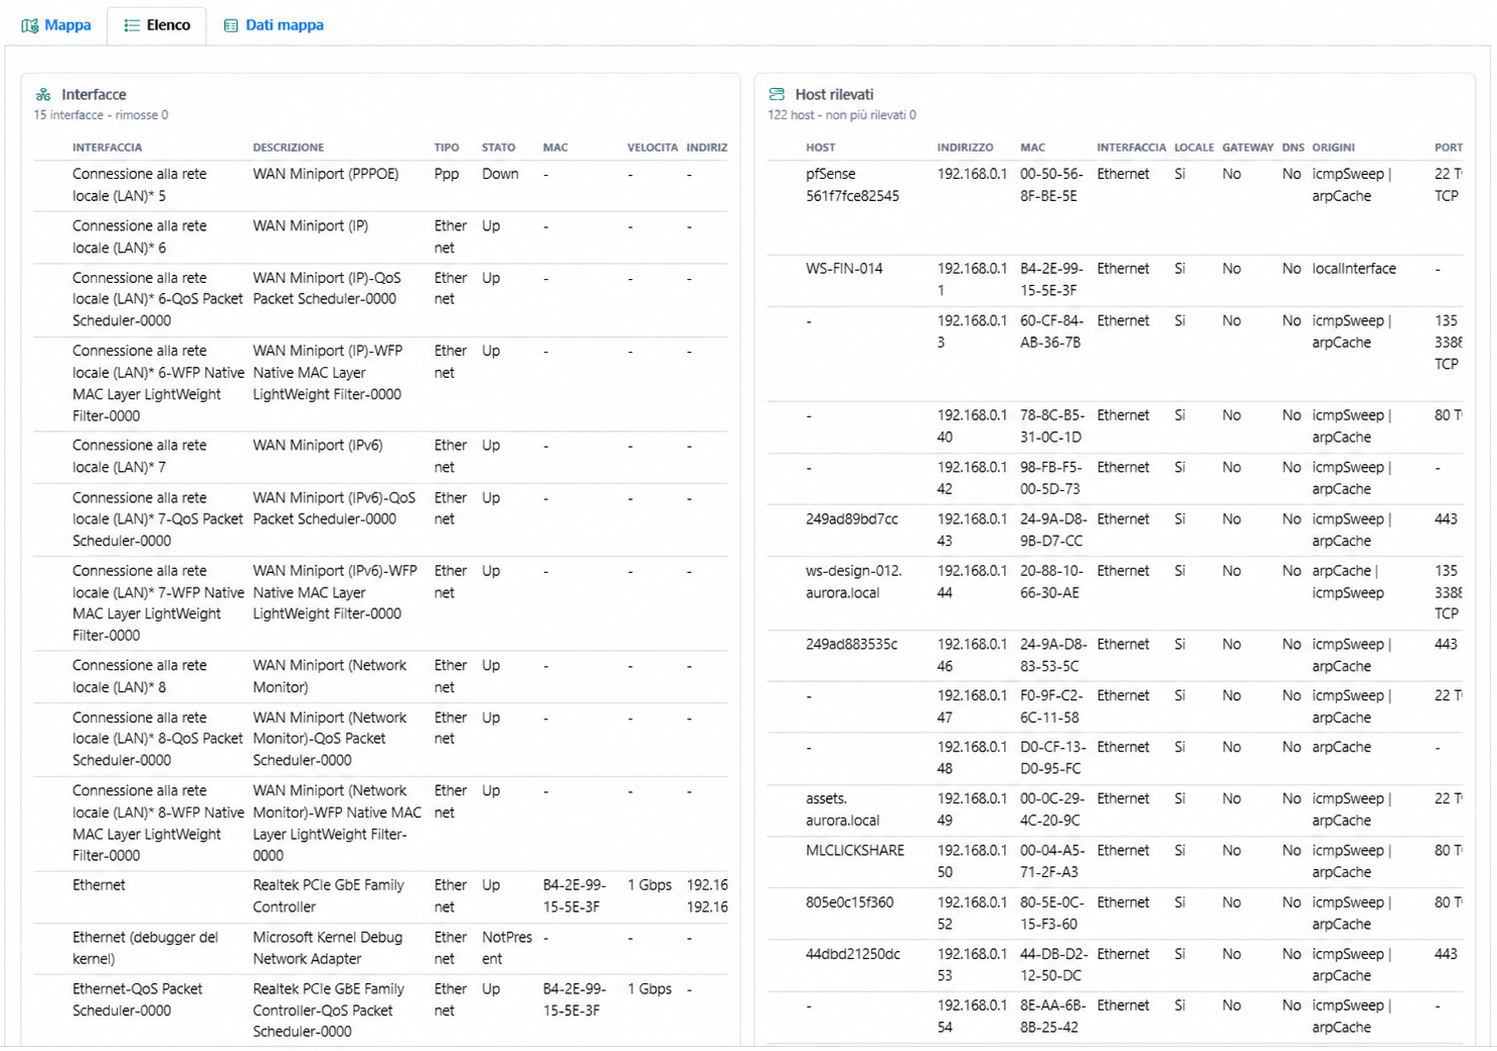
The table complements the graphical representation with consolidated technical data: interface, address, MAC, gateway, DNS, detection sources, ports and status.
Data can be exported for documentation, periodic checks and analysis with external tools.
Statuses with precise meaning
Argus describes available evidence without turning it into artificial certainty. Statuses distinguish a current presence from historical evidence or an identity that still requires verification.
The host appears in the completed acquisition of at least one selected source.
The host appears in previous scans still included in the analyzed period.
The observation contains no active confirmation or sufficient open-port evidence.
The evidence is not yet sufficient for a unique, reliable correlation.
Argus Client runs probes and collects evidence according to the selected depth. Firewalls, segmentation, routes and permissions affect what can be seen.